
Snow Time Machine

Louisville, CO

Remarkable storms and the local record, winter by winter.

Choose a city archive
Snow Time Machine

Explore a winter

Pick a winter to see the snow that fell, from the first flakes to the last storm.

Search more storms by state, decade and type →
When the first flakes arrivedBoulder · verified first-snow reporting dates

Earlier · Sep 8Later · Nov 29

Higher dots mean an earlier arrival in this sample. Swipe or use the arrows, then choose a year.

Regional event · Dec 20 – Dec 21, 2006

Denver's snowed-in December.

A December blizzard covered the Denver area. The official city storm table records 20.7 inches for the December 20–21 event.

20.7inchesDenver official climate record · storm-total snowfall

Measurements apply to their named reporting locations.
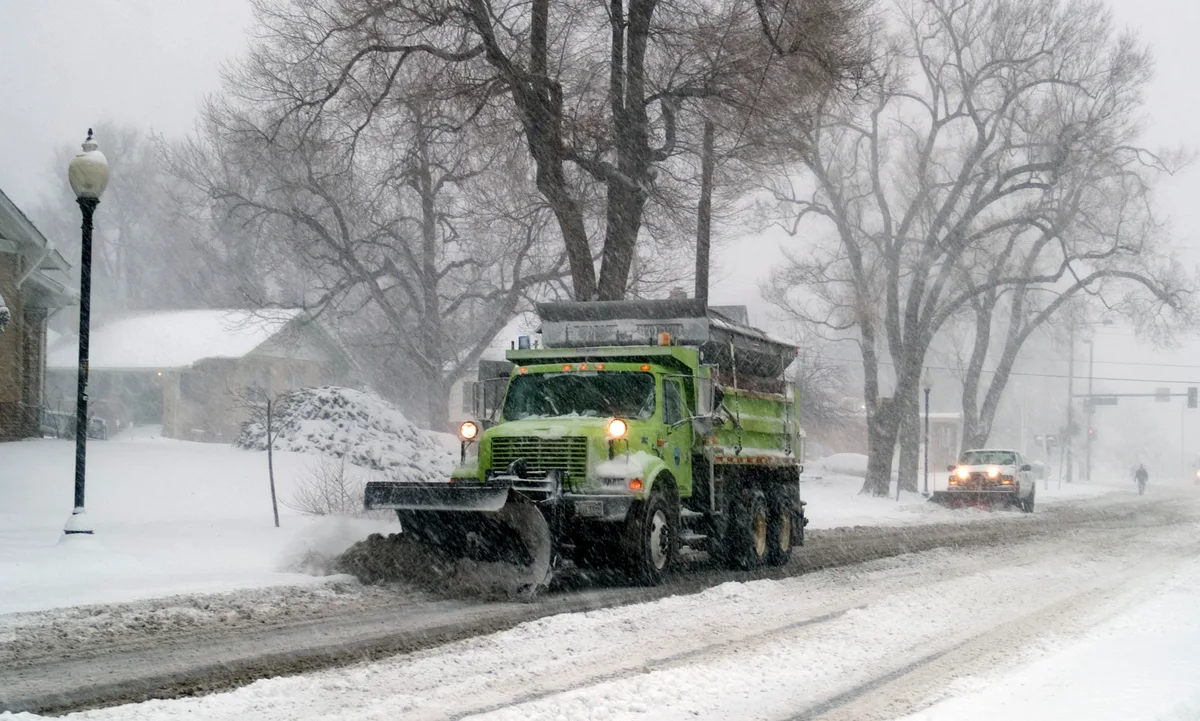
Denver, Colorado, December 20, 2006. Historical photograph by Michael Rieger / FEMA.
Documentary photograph · Denver, Colorado · December 20, 2006. Michael Rieger / FEMA · Public domain · U.S. federal work. Resized and converted to WebP; no content alteration.
Sources & event details

Regional event · Denver area. City climate storm total; neighboring towns and mountain sites have separate measurements.

Denver official climate record: 20.7 inches · storm-total snowfall. Measurement source ↗

Read the original historical coverage ↗
Official weather history

A regional storm does not establish the first seasonal snowfall at your city.

The station record

Daily snowfall reports · 2006–07

Boulder · nearby station, 12 km away

Opening station records…

More from winter 2006–07
Same winter. Another place.
Compare with another winter
Discover the earliest & latest arrivals

Among the 58 snowy complete seasons at Boulder.

Every complete season (58) Boulder · 1909–2026
First measurable snowfall at Boulder; separate from the site's reviewed typical-date and guessing sample.
WinterReporting dateFirst-day snowfall
2025–262025-11-290.31 inches
2024–252024-11-040.2 inches
2023–242023-10-280.59 inches
2022–232022-10-270.12 inches
2021–222021-11-170.31 inches
2020–212020-09-081.69 inches
2019–202019-10-103.82 inches
2018–192018-10-100.91 inches
2017–182017-10-095.98 inches
2015–162015-11-111.69 inches
2013–142013-10-040.71 inches
2012–132012-10-050.2 inches
2011–122011-10-2611.5 inches
2010–112010-11-090.31 inches
2009–102009-10-104.8 inches
2007–082007-10-210.12 inches
2006–072006-10-100.12 inches
2004–052004-11-012.99 inches
2003–042003-10-300.2 inches
2002–032002-10-230.31 inches
2001–022001-10-050.2 inches
1998–991998-11-074.09 inches
1997–981997-10-120.2 inches
1996–971996-09-263.31 inches
1977–781977-11-080.31 inches
1976–771976-10-261.81 inches
1975–761975-10-234.8 inches
1974–751974-09-122.72 inches
1973–741973-11-025.39 inches
1972–731972-10-309.61 inches
1971–721971-09-1717.99 inches
1970–711970-09-251.5 inches
1969–701969-10-032.01 inches
1967–681967-10-293.11 inches
1966–671966-10-142.99 inches
1965–661965-09-202.28 inches
1964–651964-11-145.98 inches
1963–641963-10-310.71 inches
1962–631962-11-152.52 inches
1961–621961-10-2910.2 inches
1958–591958-09-300.2 inches
1957–581957-10-251.61 inches
1956–571956-10-242.01 inches
1955–561955-10-232.01 inches
1953–541953-11-043.5 inches
1952–531952-10-142.52 inches
1949–501949-10-191.18 inches
1948–491948-10-1612.01 inches
1945–461945-09-282.01 inches
1944–451944-11-152.99 inches
1943–441943-11-014.02 inches
1941–421941-10-302.99 inches
1940–411940-11-105 inches
1938–391938-10-182.72 inches
1932–331932-10-246.3 inches
1931–321931-11-192.99 inches
1925–261925-10-177.01 inches
1909–101909-10-110.98 inches
Original historical source ↗

Single-station record; observation sites and practices may change. Source SHA256: d5bb40818716037a46c1c37b2dd7666da22a0b542821c60aa3169f18ce2ad4e5.