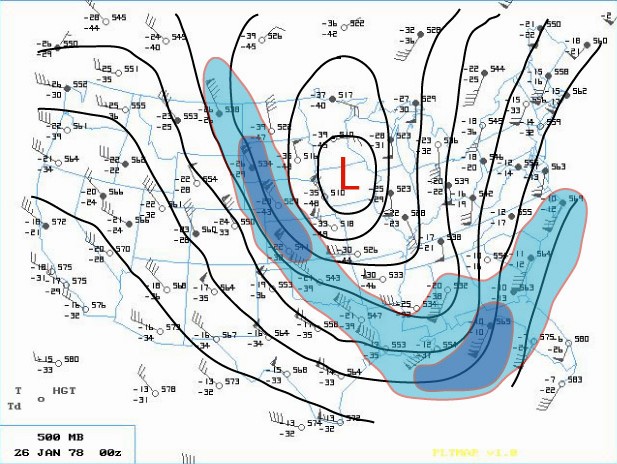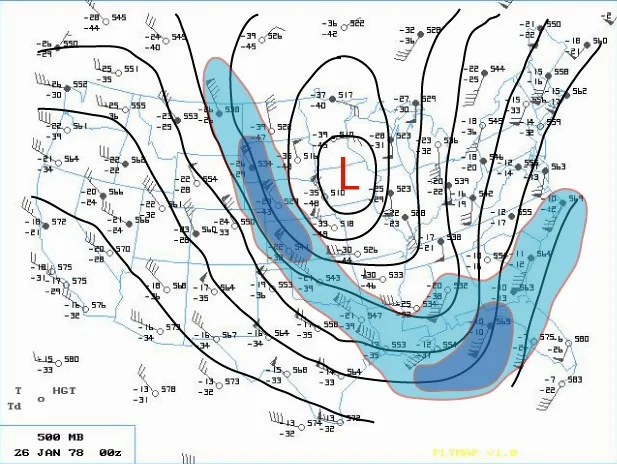
Featured story · Blizzard
The Great Blizzard of 1978 buried Muskegon in 30 inches
· Michigan and Ohio
30 inches Storm snowfall at Muskegon, Michigan
Read the storyPick a winter to see the snow that fell, from the first flakes to the last storm.
Search more storms by state, decade and type →Earlier · Oct 12Later · Dec 29
Higher dots mean an earlier arrival in this sample. Swipe or use the arrows, then choose a year.
First measurable snow at Detroit Metro Airport.
0.12inchesNew snowfall on the first reporting day · not a whole-storm total
63 days later than the preceding winter at this reference.
Detroit Metro Airport · USW00094847 · 26 km from the place point. Reporting dates are not exact snowfall onset times.
Only fully observed July–June seasons are included. At least 0.1 inch counts as measurable; missing days exclude a season and traces remain non-measurable.
Single GHCN station ID. Site and observing practices can change; this is not a homogenized city composite. Retrieved 2026-11-04. 2 incomplete seasons excluded.
NOAA / official historical source ↗Detroit Metro Airport · named reporting reference
Opening station records…
Among the 66 snowy complete seasons at Detroit Metro Airport.
| Winter | Reporting date | First-day snowfall |
|---|---|---|
| 2025–26 | 2025-11-09 | 2.2 inches |
| 2024–25 | 2024-11-21 | 0.2 inches |
| 2023–24 | 2023-10-31 | 0.2 inches |
| 2022–23 | 2022-11-12 | 0.51 inches |
| 2021–22 | 2021-11-14 | 0.71 inches |
| 2020–21 | 2020-11-17 | 0.2 inches |
| 2019–20 | 2019-11-07 | 0.2 inches |
| 2018–19 | 2018-11-09 | 1.3 inches |
| 2017–18 | 2017-12-07 | 0.59 inches |
| 2016–17 | 2016-11-19 | 0.12 inches |
| 2015–16 | 2015-11-21 | 5.98 inches |
| 2014–15 | 2014-11-13 | 0.51 inches |
| 2013–14 | 2013-11-11 | 0.51 inches |
| 2012–13 | 2012-11-23 | 0.12 inches |
| 2011–12 | 2011-11-30 | 0.59 inches |
| 2010–11 | 2010-12-01 | 0.12 inches |
| 2009–10 | 2009-12-07 | 0.2 inches |
| 2008–09 | 2008-11-16 | 0.91 inches |
| 2007–08 | 2007-11-25 | 0.2 inches |
| 2006–07 | 2006-10-12 | 0.2 inches |
| 2005–06 | 2005-11-23 | 2.28 inches |
| 2004–05 | 2004-11-25 | 0.12 inches |
| 2003–04 | 2003-11-28 | 0.2 inches |
| 2002–03 | 2002-11-22 | 1.1 inches |
| 2001–02 | 2001-12-23 | 0.51 inches |
| 2000–01 | 2000-11-14 | 0.2 inches |
| 1999–00 | 1999-12-06 | 1.3 inches |
| 1998–99 | 1998-12-29 | 0.12 inches |
| 1997–98 | 1997-10-27 | 0.12 inches |
| 1996–97 | 1996-11-11 | 0.12 inches |
| 1994–95 | 1994-12-06 | 0.98 inches |
| 1993–94 | 1993-10-30 | 0.31 inches |
| 1992–93 | 1992-10-20 | 0.39 inches |
| 1991–92 | 1991-11-07 | 0.98 inches |
| 1990–91 | 1990-12-03 | 3.39 inches |
| 1989–90 | 1989-10-19 | 2.72 inches |
| 1988–89 | 1988-11-06 | 0.39 inches |
| 1987–88 | 1987-11-19 | 0.12 inches |
| 1986–87 | 1986-11-11 | 0.2 inches |
| 1985–86 | 1985-11-15 | 0.12 inches |
| 1984–85 | 1984-11-11 | 4.09 inches |
| 1983–84 | 1983-11-11 | 1.69 inches |
| 1982–83 | 1982-11-26 | 1.81 inches |
| 1981–82 | 1981-10-23 | 0.12 inches |
| 1980–81 | 1980-10-27 | 2.28 inches |
| 1979–80 | 1979-11-08 | 0.12 inches |
| 1978–79 | 1978-11-21 | 0.51 inches |
| 1977–78 | 1977-11-11 | 0.39 inches |
| 1976–77 | 1976-11-04 | 0.12 inches |
| 1975–76 | 1975-11-21 | 0.12 inches |
| 1974–75 | 1974-11-13 | 3.7 inches |
| 1973–74 | 1973-11-09 | 0.12 inches |
| 1972–73 | 1972-11-14 | 2.52 inches |
| 1971–72 | 1971-11-09 | 1.61 inches |
| 1970–71 | 1970-11-14 | 0.98 inches |
| 1969–70 | 1969-11-19 | 1.42 inches |
| 1968–69 | 1968-12-01 | 0.59 inches |
| 1967–68 | 1967-11-04 | 0.12 inches |
| 1966–67 | 1966-11-02 | 4.69 inches |
| 1965–66 | 1965-11-28 | 0.39 inches |
| 1964–65 | 1964-11-19 | 2.2 inches |
| 1963–64 | 1963-12-02 | 0.31 inches |
| 1962–63 | 1962-12-05 | 0.2 inches |
| 1961–62 | 1961-12-08 | 0.39 inches |
| 1960–61 | 1960-11-06 | 0.31 inches |
| 1959–60 | 1959-11-12 | 3.58 inches |
Single-station record; observation sites and practices may change. Source SHA256: 52d413a320ed7f8a8577ba1abf0818c0001f48a28efef811633526aa7b6a3a9e.