Snow Time Machine

Harrisonburg, VA

Remarkable storms and the local record, winter by winter.

Choose a city archive
Snow Time Machine

Explore a winter

Pick a winter to see the snow that fell, from the first flakes to the last storm.

Search more storms by state, decade and type →
When the first flakes arrivedDavis 3se · verified first-snow reporting dates

Earlier · Oct 2Later · Nov 22

Higher dots mean an earlier arrival in this sample. Swipe or use the arrows, then choose a year.

Regional comparison · Feb 5 – Feb 6, 2010

A blizzard here. A near miss there.

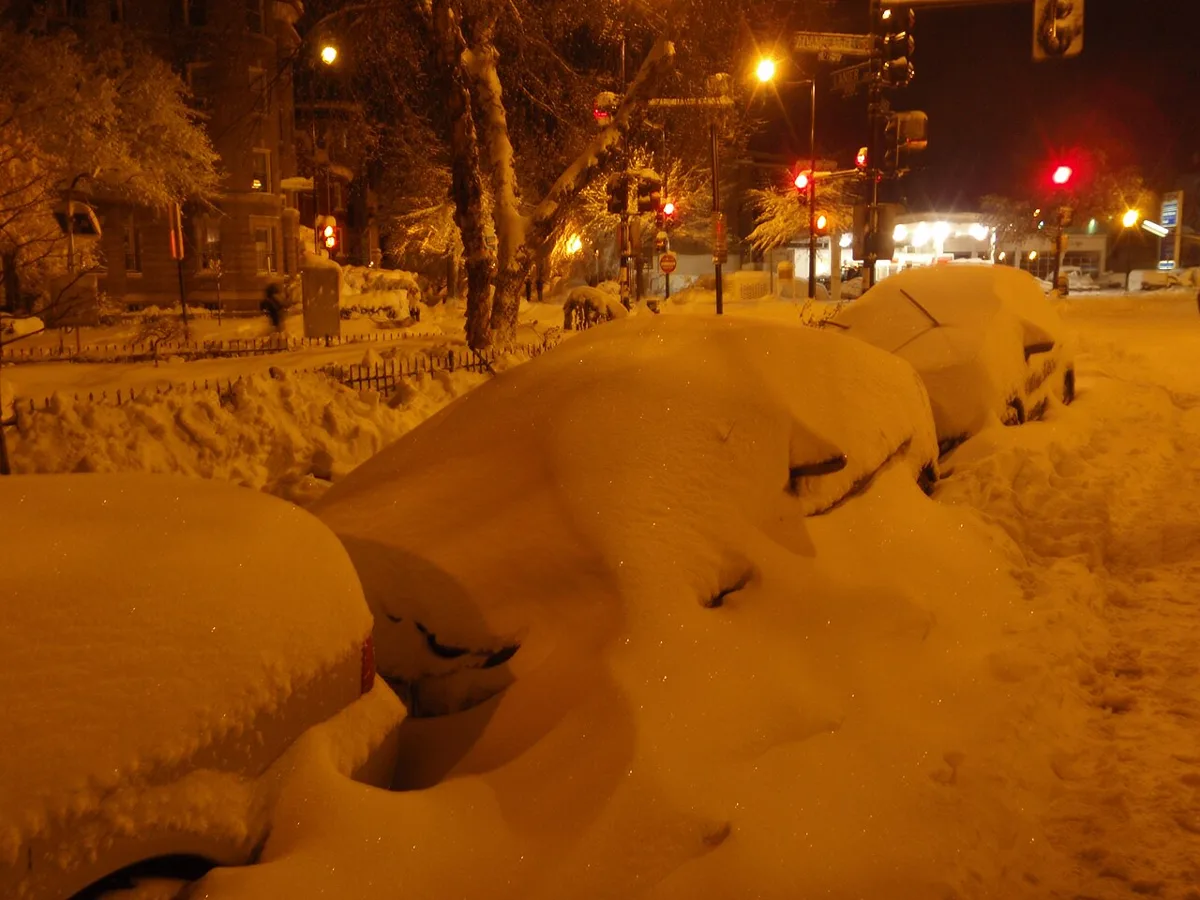
The February 5–6 storm buried the Mid-Atlantic while New York City's Central Park reported only a trace.

Measurements apply to their named reporting locations.

Adams Morgan, Washington, D.C., February 6, 2010. Historical photograph by ZeWrestler.
Documentary photograph · Adams Morgan, Washington, D.C. · February 6, 2010. ZeWrestler / Wikimedia Commons · CC BY 3.0. Resized and converted to WebP; no content alteration.
Same event. Different places.

Dulles Airport32.4 inches
storm-total snowfall
Philadelphia28.5 inches
storm-total snowfall
Reagan National Airport17.8 inches
storm-total snowfall
Central ParkTrace

Trace

storm-total snowfall
Sources & event details

Regional storm and documented near miss · Mid-Atlantic through New York City. Each report keeps its named location and original storm period.

Dulles Airport: 32.4 inches · storm-total snowfall. Measurement source ↗

Philadelphia: 28.5 inches · storm-total snowfall. Measurement source ↗

Reagan National Airport: 17.8 inches · storm-total snowfall. Measurement source ↗

Central Park: Trace · storm-total snowfall. Measurement source ↗

Read the original historical coverage ↗
Official weather history

Another official account ↗
Official weather history

A regional storm does not establish the first seasonal snowfall at your city.

The station record

Daily snowfall reports · 2009–10

Davis 3se · nearby station, 87 km away

Opening station records…

More from winter 2009–10
Same winter. Another place.
Compare with another winter
Discover the earliest & latest arrivals

Among the 23 snowy complete seasons at Davis 3se.

Every complete season (23) Davis 3se · 2002–2026
First measurable snowfall at Davis 3se; separate from the site's reviewed typical-date and guessing sample.
WinterReporting dateFirst-day snowfall
2025–262025-11-101.42 inches
2023–242023-11-012.99 inches
2022–232022-10-191.1 inches
2021–222021-11-020.59 inches
2020–212020-10-310.2 inches
2019–202019-10-170.2 inches
2018–192018-10-212.28 inches
2017–182017-10-260.12 inches
2016–172016-10-230.59 inches
2015–162015-11-220.31 inches
2014–152014-11-010.59 inches
2013–142013-10-246.1 inches
2012–132012-10-090.98 inches
2011–122011-10-023.39 inches
2010–112010-11-050.71 inches
2009–102009-10-183.11 inches
2008–092008-10-284.61 inches
2007–082007-11-070.31 inches
2006–072006-10-242.28 inches
2005–062005-10-257.4 inches
2004–052004-10-171.1 inches
2003–042003-10-231.81 inches
2002–032002-10-180.31 inches
Original historical source ↗

Single-station record; observation sites and practices may change. Source SHA256: bad502b275c34b5892526265b17201a80a6ef1cdfe0d6afe498b3f81cf07ff21.